 Gold Daily Insights
Tag
DXY and Gold Correlation
Welcome to my archive on the DXY and gold correlation. Because bullion is priced in Dollars, the Index's daily swings are often the first place I look before opening my charts. In this category, I document how I read DXY strength or weakness to gauge the underlying bias on my spot gold trades.
Gold Market Analysis
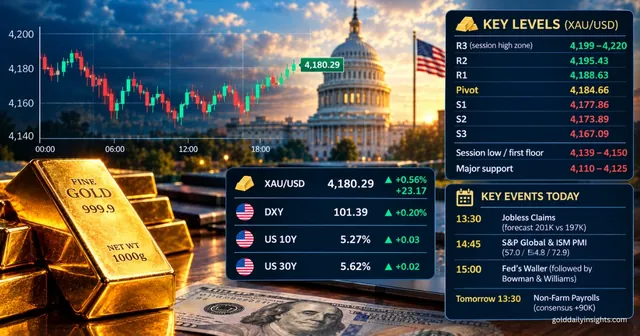
Gold Analysis #38: Rebound Holds Above $4,180 | 1 Oct
Gold claws back above $4,180 on 1 October as the dollar stays firm and Treasury yields near multi-year highs cap the bounce. Levels, Fed outlook and today's calendar.
2026-10-01
Gold Market Analysis
Market Analysis #32: Gold Slips to $4,320 | 23 Sep 2026
Gold eases toward $4,320 as a firm dollar and hawkish Fed rhetoric cap gains, with traders parked ahead of US PMIs and Thursday's Trump-Xi summit.
2026-09-23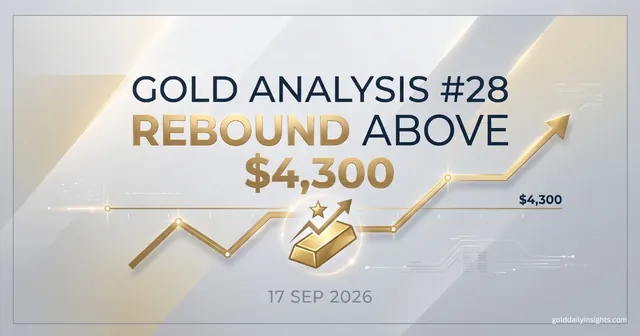
Gold Market Analysis
Gold Analysis #28: Rebound Above $4,300 | 17 Sep 2026
Gold rebounds above $4,300 after the Fed's first rate hike since 2023. I walk through DXY, yields, key levels and today's US data for XAU/USD, 17 September.
2026-09-17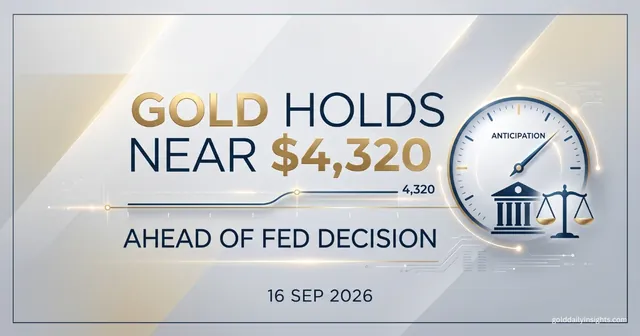
Gold Market Analysis
Market Analysis #27: Gold Holds Near $4,320 | 16 Sep 2026
Gold hovers near $4,320 on 16 September, awaiting the Fed's rate call and dot plot, with Chair Warsh's tone likely to set XAU/USD's next big directional move.
2026-09-16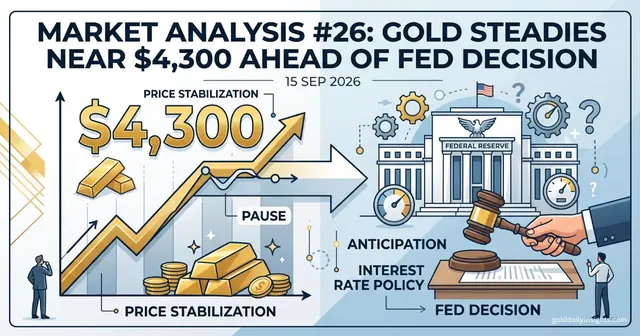
Gold Market Analysis
Market Analysis #26: Gold Steadies Near $4,300 Ahead of Fed Decision | 15 Sep 2026
Gold trades near $4,300 as traders brace for Wednesday's Fed rate decision under Chair Warsh, with 10-year yields near 5% and Middle East risk still in play.
2026-09-15
Gold Market Analysis
Market Analysis #25: Gold Tests $4300 Pre-Fed | 14 Sep 2026
Gold slips toward $4300 as traders brace for this week's Fed decision, with a strong dollar, high yields and hot inflation data keeping pressure on XAU/USD today.
2026-09-14
Gold Market Analysis
Gold Analysis #22: Rebound Above $4,400 | 9 Sep 2026
Gold rebounds above $4,400 on 9 September as the US dollar drops. Here is my daily XAU/USD technical and fundamental breakdown ahead of the Fed Beige Book.
2026-09-09
Gold Market Analysis
Market Analysis #19: Gold Braces for NFP Near $4466 | 4 September 2026
My daily XAU/USD market analysis for 4 September. Gold consolidates near $4466 ahead of US Nonfarm Payrolls. See my key levels and trading scenarios.
2026-09-04
Gold Market Analysis
Market Analysis #18: Gold Reclaims $4420 Amid Dollar Weakness | 3 Sep 2026
My daily XAU/USD technical and fundamental analysis for 3 September 2026. Gold pushes above $4420 as the US dollar softens ahead of ISM Non-Manufacturing data.
2026-09-03
Gold Market Analysis
Market Analysis #15: Gold Slides on Hawkish Fed | 31 Aug 2026
My technical and fundamental analysis for XAU/USD this 31 August. I am watching the fallout from Fed Chair Warsh's hawkish tone and key support levels.
2026-08-31
Gold Market Analysis
Market Analysis #5: Gold Tests $4400 As Dollar Sinks | 17 Aug 2026
My daily XAU/USD analysis for 17 August. Gold pushes towards $4400 amid a softer US Dollar and shifting Fed expectations. See my key levels for today.
2026-08-17
Gold Market Analysis
Market Analysis #2: Gold Holds $4400 Pre-CPI | 12 Aug 2026
I break down my gold chart this morning, 12 Aug, as XAU/USD holds $4,400 ahead of US CPI data. Escalating Hormuz tensions are keeping the bullish trend alive.
2026-08-12