 Gold Daily Insights
Disclaimer: This article is for educational and informational purposes only. It is not financial advice, and nothing here should be taken as a recommendation to buy or sell any asset. I’m simply sharing my own reading of the market and what I’m personally watching on my own account.
The first thing I noticed when I opened MT5 this morning was how controlled gold’s overnight range looked compared to the bruising it took last week. After a September that genuinely hurt anyone leaning long, price has clawed its way back above $4,180, and the question I’m asking myself isn’t “is this a reversal?” — it’s “can this bounce survive contact with the US dollar and a 5.3% ten-year yield?”
Opening
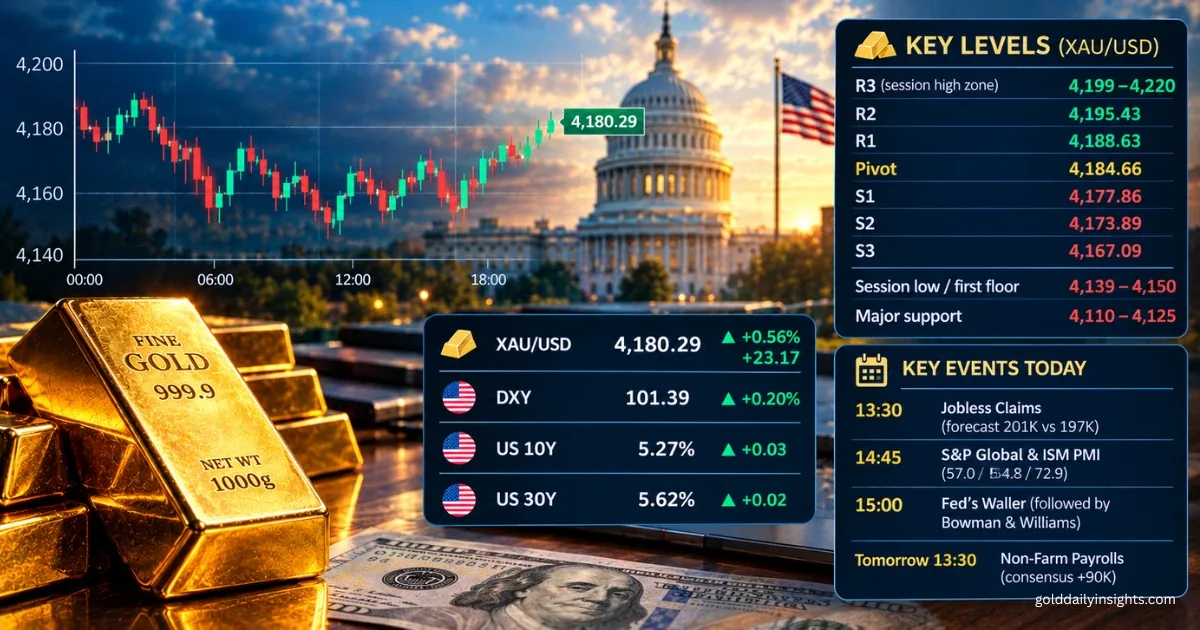
XAU/USD is trading at $4,180.29, up $23.17 on the day, or +0.56%. That follows a previous close around $4,157.12, and today’s range so far has been wide for a European morning: a low of $4,139.43 and a high of $4,192.99. In other words, gold has already travelled more than $50 before London has properly woken up.
Zoom out and the context matters more than the daily tick. September closed with a loss of more than 6%, gold’s worst month since June, snapping a two-month winning streak and dragging price down from levels well above $4,500 earlier in the month. We’re still roughly a quarter below the January record. Today’s bounce is real, but it’s a bounce inside a correction, not yet a change of regime.
Fundamental Landscape
The macro picture hasn’t actually flipped bullish — it’s just become a little less hawkish, and gold is trading that nuance very literally. The Fed hiked 25 basis points on 16 September, its first increase since 2023, taking the target range to 3.75–4.00%. The dot plot still points to one more hike by year-end in the median projection, so this is not a dovish Fed by any stretch.
What has shifted is the probability of an October move. August PCE inflation, released Wednesday, came in soft — headline +0.3% m/m and 3.4% y/y, core +0.2% m/m and 3.0% y/y, both below forecast. Pricing for an October hike has fallen from somewhere around 70% a week ago to closer to 38% now. New York Fed President Williams leaned dovish, saying there’s no need to rush into another increase. That’s the relief valve behind this morning’s bounce.
But I don’t think it changes the bigger problem for gold: yields. The 10-year Treasury yield is sitting close to 5.27–5.30%, a level last seen roughly two decades ago, and the 30-year is above 5.6%. Real yields (10-year TIPS) are near 2.9%, a multi-year high. That’s the actual opportunity cost gold is competing against, and soft PCE alone doesn’t fix it. The dollar index is firm too — DXY futures are at 101.39, up 0.20% today, holding near the top of their 52-week range of 95.36–101.57. For gold to really extend, I want to see the dollar break down, not just inflation data come in a touch soft.
Oil and the US–Iran situation remain the wildcard running underneath all of this. Higher oil has been feeding inflation expectations and, paradoxically, pressuring gold by lifting yields and the dollar rather than supporting it as a safe haven. When oil has eased over the past week, gold has found support — that relationship is worth watching all session.
Asia & Europe Sessions
Asia set today’s low near $4,139, with dip-buyers stepping in almost immediately — that level lines up closely with where sellers exhausted themselves after the September slide. From there, price built a steady climb into the London open, pushing through $4,157 (yesterday’s close) and on towards the $4,190s without much hesitation.
What stands out to me is that this isn’t a violent, news-driven spike. It looks more like controlled short-covering and quarter-start repositioning after a brutal September, with buyers testing how much appetite is left above $4,180 before the US data arrives. The dollar has firmed alongside gold for parts of this move, which is the one thing nagging at me — gold and DXY rising together is unusual, and it’s typically a sign the rally is being driven by positioning rather than a genuine change in the macro story.
Technical Analysis
There’s a real split between timeframes right now, and I think that split is the whole story. My 30-minute and hourly readings are Strong Buy, RSI(14) sits at 58.9 and MACD is positive, which fits the session’s recovery. But step back to the daily and weekly charts and the picture flips to Strong Sell — the broader structure built in September hasn’t been repaired by one good morning.
Moving averages tell the same split story. Price is comfortably above the 10, 20, 50 and 100-period averages (all Buy), which supports the idea that the immediate trend has turned up. But it’s still sitting just under the 5-period average near $4,185.5 and well under the 200-period average around $4,190.3 — both flagged Sell. That cluster just overhead, between roughly $4,185 and $4,195, is exactly where I’d expect today’s rally to be tested hardest. ATR is flagging high volatility, so whichever way this resolves, I don’t expect it to be slow.
Key Levels
- Pivot (classic): $4,184.66 — the line in the sand for today’s session
- Resistance 1: $4,188.63
- Resistance 2: $4,195.43, just ahead of the psychological $4,200 round number
- Resistance 3 / session high zone: $4,199–$4,220, today’s high plus the broader September 30 ceiling
- Bigger resistance: $4,250–$4,275, then $4,300, which has capped every meaningful rebound attempt since the correction began
- Support 1: $4,177.86
- Support 2: $4,173.89
- Support 3: $4,167.09
- Session low / first real floor: $4,139–$4,150, today’s Asian low and last week’s reaction zone
- Major support: $4,110–$4,125, the late-September low that defines whether this correction is over or just pausing
My Gold Outlook Today
My base case is that gold stays capped somewhere in the $4,150–$4,200 band into this afternoon’s US data, with the pivot at $4,184.66 acting as the real decision point. A clean hold above $4,185–$4,195 with the dollar softening opens the door to $4,220 and, if things really go our way, a test of $4,250–$4,300.
My alternative scenario is the one I’m honestly leaning towards given the weekly chart: a strong ISM print or a run of hawkish Fed speak today pushes yields and the dollar back up, gold fails below $4,185, and we’re back probing $4,150 and then $4,110–$4,125 before Friday’s payrolls even arrive. My invalidation level for the bullish case is a clean break and close below $4,139 — that would tell me the Asian dip-buyers have given up and the September trend is back in control.
What I’m Watching Today
- 13:30 BST – US Initial & Continuing Jobless Claims: forecast 201K vs 197K prior. A weak print softens the dollar and helps gold; a resilient reading does the opposite.
- 14:45–15:00 BST – S&P Global & ISM Manufacturing PMI, plus ISM Prices Paid: forecasts 57.0, 54.8 and 72.9 respectively. The Prices Paid component matters most to me — a hot reading reinforces the sticky-inflation, higher-for-longer story that’s been gold’s biggest enemy since September.
- 15:00 BST – Fed’s Waller speaks, followed by Bowman and Williams later in the session: I want to hear whether the “no rush” tone from earlier in the week holds, or whether anyone leans hawkish like Kashkari did last week.
- Tomorrow, 13:30 BST – US Non-Farm Payrolls: consensus around +90K. This is realistically the bigger event than anything today, and I expect some position-squaring into it this afternoon.


