Gold Daily Insights
Disclaimer: This article is for educational and informational purposes only and does not constitute financial advice. Trading gold carries a high level of risk. Always do your own research and make your own decisions.
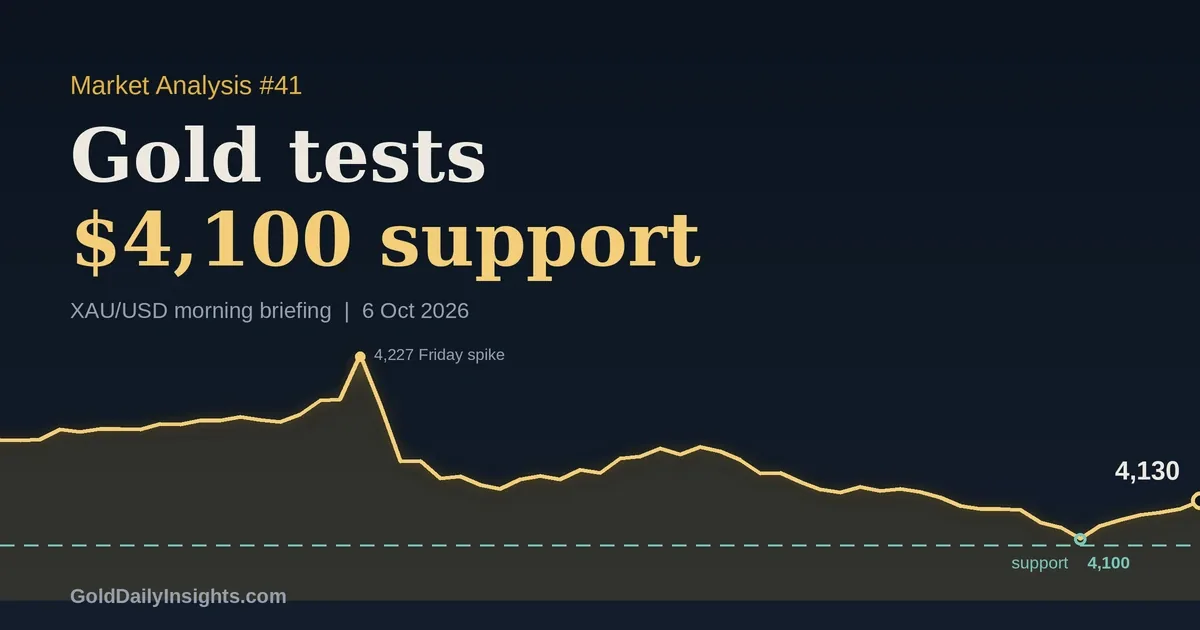
Before the US session gets moving, there is one level I cannot ignore: $4,100. Gold tagged a low of $4,103.70 in the Asian session, a two-month low, and buyers stepped in just above the round number. Here is how I am reading it this morning.
Opening
Spot gold is trading around $4,130, down roughly 0.25% on the day after Monday’s close near $4,140. The intraday range so far runs from $4,103.70 to $4,152.29, so the market has already covered nearly $50 before London is fully awake.
Zoom out and the picture is heavy. Gold is down about 1.2% on the week, close to 6.7% on the month and roughly 26% below the January record near $5,595. My reading is that this is a market still digesting a big correction, not one that has found its feet.
Fundamental Landscape
The odd thing about this move is that the news flow should have helped gold. Friday’s US payrolls came in at just +29k against around 90k expected, unemployment ticked up to 4.2% and earlier months were revised lower. October hike odds collapsed to roughly 22%. Gold spiked towards $4,227 and then gave back the entire move, closing the day lower.
To me, that tells you where the real pressure sits. The long end of the Treasury curve is doing the damage, not the front end. The US 10-year yield is around 5.3%, a multi-decade high, and the 10-year real yield is sitting just under 3%. That is a heavy opportunity cost for a metal that pays nothing. The dollar index is near 102, close to an 18-month high, with the euro under pressure from French fiscal worries.
Monday’s ISM Services report reinforced the same theme. The headline slipped to 54.9, but prices paid jumped to 74.0, a four-year high. Weaker jobs and hotter prices is not a recipe for a Fed pivot. The Fed funds range is 3.75-4.00% after September’s hike, and the market still leans towards another move by December. Oil around $100 keeps that inflation story alive, which is why I do not see gold getting much of a safe-haven bid from the Middle East headlines right now.
Asia & Europe Sessions
The Asian session was where the damage was done. Gold pressed lower into the $4,100 area, printed the $4,103.70 low and then found buyers. The bounce was orderly rather than aggressive, and by the start of Europe price had worked back to around $4,130.
London has so far been quiet. Price is chopping around the $4,130 area with small swings either side, which I read as the market waiting for the US data and the Fed speakers rather than taking a view. A dip that gets bought is encouraging, but I would not call it a reversal.
Technical Analysis
On the bigger picture, the daily chart is bearish. Price sits below the 50-day average around $4,330 and the 100-day near $4,270, and the daily technical read is a firm sell. The weekly view tells the same story, with a sequence of lower highs since the early-September peak near $4,440. The weekly chart also shows how far gold has travelled from the January record, and that is why I treat rallies with caution until the structure changes.
On the intraday M30 and H1 charts it is a different mood. Momentum is neutral, price is hugging the short-term averages around $4,133 and $4,142, and the daily pivot sits at $4,132. This is a tight, indecisive range inside a downtrend. The Friday spike to $4,227 stands out as a clear rejection, and every bounce since has been sold at lower levels.
My reading is simple: the trend is down, the short-term structure is a pause, and the $4,100 zone is where that pause either holds or breaks.
Key Levels
- $4,152: today’s high so far and the first level I want to see reclaimed.
- $4,160-$4,170: Monday’s high sits at $4,170, and this is the first real recovery test.
- $4,190: next resistance. A hold above it would make me take the bounce seriously.
- $4,214-$4,227: the supply zone and Friday’s post-payrolls spike high.
- $4,125-$4,132: the immediate pivot area, where price is trading now.
- $4,103-$4,100: today’s low and the round number. This is the line in the sand.
- $4,098: the Fibonacci retracement just below, which sits right under that cluster.
- $4,075-$4,073: first support if $4,100 gives way.
- $4,000: the big psychological level and the next major target on a proper breakdown.
My Gold Outlook Today
Main scenario: I expect a heavy range with a downside lean, roughly $4,100 to $4,170. While the 10-year yield stays above 5.3% and the dollar stays firm, rallies should struggle around $4,160-$4,190, and dips should find some buying around $4,100-$4,125.
Alternative scenario: the bullish case strengthens if gold reclaims $4,170 and holds above $4,190, ideally with yields easing and the dollar softening after a decent 3-year auction or dovish Fed comments. That opens $4,214 and then the $4,227 area.
Invalidation: a clean break and hold below $4,098-$4,100 would put the range idea to bed and open $4,075, then $4,000. On the other side, a sustained hold above $4,190 would invalidate my bearish lean.
What I’m Watching Today
- 13:15 and 13:30 BST: US weekly ADP employment and the August trade balance. Neither is a major mover, but a surprise could nudge yields.
- 14:05 and 15:45 BST: Fed speakers Williams and Bowman. After September’s hike, any hint on the October or December path will matter for yields.
- 18:00 BST: the US 3-year Treasury auction. A weak result would push yields higher and add pressure on gold.
- Into Wednesday, 19:00 BST: the FOMC minutes. I expect traders to position cautiously ahead of them, with US CPI on 14 October the bigger test after that.