 Gold Daily Insights
Disclaimer: This article is for educational and informational purposes only. It reflects my personal reading of the market and does not constitute financial or investment advice. Trading gold carries a high level of risk, so please do your own research and only risk what you can afford to lose.
The first thing I noticed when I opened MT5 this morning was the gap, and how little gold did to fill it. Friday’s calm close near $4,285 felt like a distant memory within a few hours of the Asian open, and the chart now looks very different from the one I was working with last week.
Opening
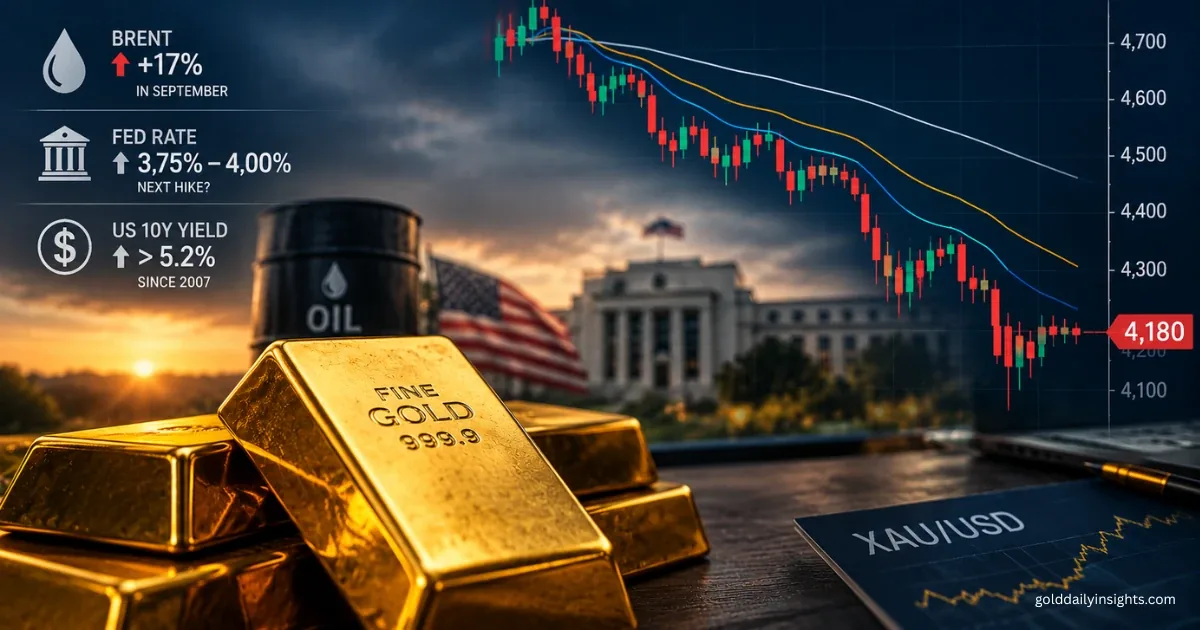
Spot gold is trading around $4,180 as I write, down roughly 2.4% on the day. The session low so far is about $4,175, and the price is sitting close to that area rather than bouncing away from it. That is a heavy move for a Monday morning.
The wider damage is just as notable. Gold is down almost 4% on the week and more than 6% over the month, and silver is falling even faster, at around $61.70. Even after this drop, gold is still about 11% higher than a year ago, but it now sits roughly 25% below its January record near $5,600. This is a proper correction, not a routine pullback.
Fundamental Landscape
The story today is not “geopolitical risk equals bullish gold”. It is a chain reaction. Brent is trading around $106, up roughly 17% in September, after President Trump rejected Iran’s proposal to reopen the Strait of Hormuz while still saying talks should resume. Higher oil keeps inflation fears alive, and inflation fears keep the Federal Reserve in tightening mode.
The Fed raised rates by 25 basis points to 3.75%–4.00% on 16 September, and the median projection points to a year-end rate of 4.1%, which implies at least one more hike. The market now prices roughly a two-in-three chance of another increase in October. That has pushed the US 10-year yield above 5.2%, its highest level since 2007, and the dollar index is hovering around 101, close to a two-month high and on course for its best month since June.
My reading is simple: gold pays no income, and when yields and the dollar rise together, that is a very hard combination to fight. Right now the bond market is in charge, not fear.
I do not think this erases the longer-term story. Central banks are still buying, and global gold ETF holdings reached a record in August. To me, this looks more like a rates and positioning correction than a collapse in demand, although those buyers clearly are not stepping in aggressively at these levels yet.
Today’s calendar is light. Fed Governor Bowman speaks at 13:15 UK time, the Dallas Fed manufacturing survey follows at 15:30, and Fed Governor Cook speaks at 18:25. The heavy hitters come later in the week, with US PCE inflation on Wednesday and September nonfarm payrolls on Friday.
Asia & Europe Sessions
Gold closed Friday near $4,285 and opened the week with a gap lower. From there the selling was steady rather than chaotic. By the early hours it had slipped to around $4,224, and it broke through $4,200 during the Asian morning, touching roughly $4,198 at one point. That was the weakest level since 5 August and put gold on course for its biggest daily fall since 1 September.
Into the European morning the price pushed on to the $4,175 area and then stalled, with a small bounce back to about $4,180 as London got going. There has been no real recovery attempt yet, just a pause. I would not read too much into that until I see how the market behaves once US yields start trading.
Technical Analysis
On the bigger picture, the weekly chart shows the January spike towards $5,600 followed by a series of lower highs. The daily chart tells the same story from the August peak near $4,700. For about two weeks gold had been holding a range between roughly $4,240 and $4,400, and this morning that floor gave way. Price is now below the 21-, 50- and 100-day averages, which sit around $4,344, $4,321 and $4,299, with the 200-day much higher near $4,541.
On the intraday M30 and H1 charts, the move is close to vertical, with very few pullbacks along the way. That kind of price action tells me sellers are in control, but it also means the move is stretched. Momentum on the lower timeframes is deeply oversold, with the 30-minute RSI around 16. Oversold can stay oversold in a trending market, so I see it as a warning against chasing shorts here rather than a reason to buy.
The intraday pivot levels cluster tightly between $4,175 and $4,198, which shows how compressed the price is around the lows.
Key Levels
- $4,175: today’s low and the first support. If this goes, the door opens lower.
- $4,146 to $4,168: the next support zone if the session low breaks.
- $4,100: a round-number level and the next obvious area after that.
- $4,019 to $4,000: the early August low and the major psychological floor. This is a bigger-picture zone, not an intraday target.
- $4,200: the level that gave way this morning. I now treat it as resistance on any bounce.
- $4,230 to $4,240: former support that held several times and the area where I would expect sellers to return.
- $4,264 to $4,300: the next hurdles, including the round $4,300 and the area of the 100-day average.
- $4,344: the 21-day average. A recovery back here would be needed before I could call the daily structure repaired.
My Gold Outlook Today
My main scenario is that pressure stays on gold while it trades below $4,240, but I expect choppy trading rather than a straight line down. After a drop this size, a bounce into $4,200 to $4,240 would not surprise me, and that zone is where I would want to see whether sellers step back in. If $4,175 gives way, I would be looking at $4,146 to $4,168 next, then $4,100. A deeper flush towards $4,019 and $4,000 becomes more realistic later in the week if PCE or payrolls reinforce the hike story.
The alternative scenario is a technical rebound. If gold holds the $4,175 area, yields ease and oil cools, short-covering could lift the price back above $4,200 and towards $4,230 to $4,240. Frankly, that would need help from outside, such as a softer dollar or credible progress on the Iran talks, which could lower oil and ease rate expectations.
My bearish view weakens if gold recovers and holds above $4,264, and it would be properly challenged above $4,300. Until then, I see continuation as more likely than not, but far from guaranteed.
What I’m Watching Today
- Oil and Iran headlines: Brent around $106 is the engine behind the yield story, and any real news on the Strait of Hormuz could move it quickly.
- US Treasury yields and the dollar index: if the 10-year pushes above its recent high or the dollar index extends beyond 101, I expect more pressure on gold.
- Bowman at 13:15 and the Dallas Fed survey at 15:30 (UK time): not the biggest events of the week, but hawkish comments could keep the October hike debate alive.
- Cook at 18:25 and the daily close: I want to see where gold finishes relative to $4,200 and $4,175, because that will set the tone before Tuesday’s data.


