 Gold Daily Insights
Educational and informational content only. Nothing in this article is financial advice, and I am not recommending that you buy or sell anything. Trading gold carries a real risk of loss, so please do your own research and only risk what you can afford to lose.
The first thing that struck me when I opened MT5 this morning was how tidy the bounce looks compared with how ugly the week has been. Gold is sitting around $4,280 after a run of lower highs, and my job today is to work out whether this is the start of something or just a pause for breath.
Opening
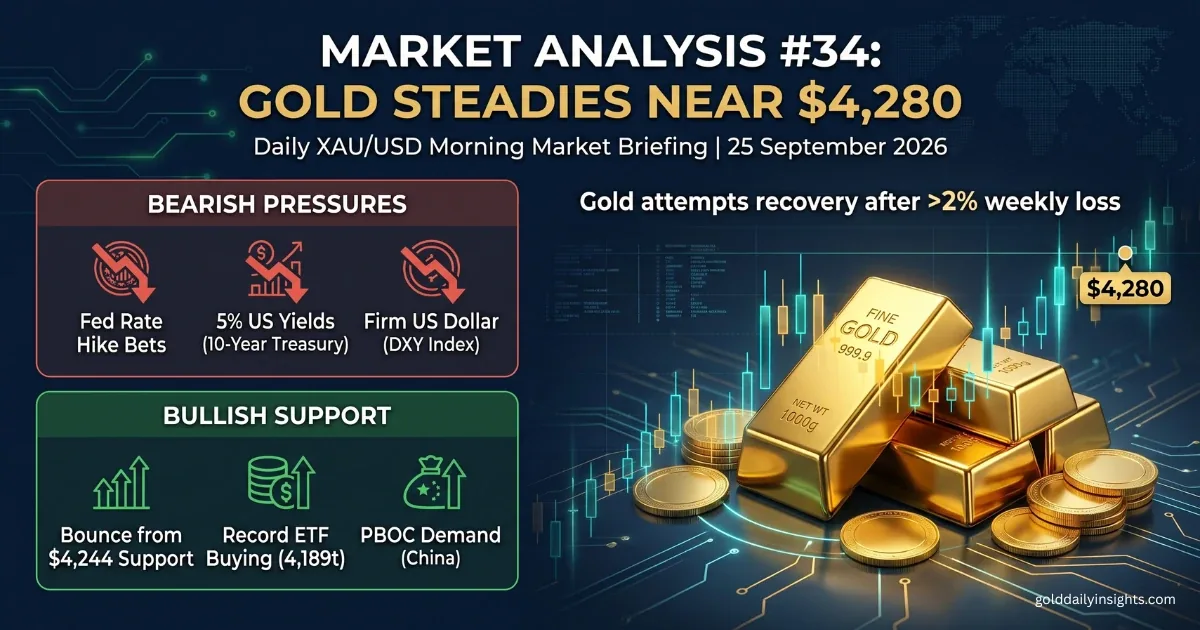
XAU/USD is trading around $4,280, up roughly 0.15% on the day after Thursday’s close at $4,273.67. So far the session has covered a range of about $4,257 to $4,296. That still leaves gold down more than 2% on the week and around 8% over the past month, and it is sitting roughly 23% below the 52-week high near $5,595. My reading is that the bounce is small while the damage behind it is much bigger, and I do not want to confuse the two.
Fundamental Landscape
Everything starts with the Fed. On 16 September it raised rates by 25 basis points to 3.75%-4.00%, the first hike since 2023, and the vote was unanimous. What hurt gold more, in my view, was the message around the decision. The median projection now points to 4.1% by the end of 2026, which leaves room for another move, and the speakers since then have not tried to talk the market out of it. Anna Paulson has said some modest additional tightening could be warranted, and John Williams has said there is still a lot of work to do on inflation. Markets are pricing better than even odds of another hike in October.
That repricing has shown up in Treasuries. The 10-year yield is above 5.1%, the 10-year real yield was around 2.76% on Wednesday, and the 30-year has just reached a two-decade high after Thursday’s jump in oil. For an asset that pays nothing, those are heavy numbers. The dollar has followed: the dollar index is on course for a second straight weekly gain, its first back-to-back advance in more than three months, with EUR/USD near a two-month low around 1.1370 and sterling close to 1.3220. This morning dollar index futures are easing a little, around 100.87 after an earlier high near 101.05, and I think that is one reason gold has been able to bounce.
The Iran situation is the part I find most interesting. Traffic through Hormuz is still well below normal, and in a different market I would expect that to lift gold. This week it has not, because the same disruption pushes oil higher, lifts inflation expectations and makes further hikes more likely. In other words, the rates channel is outweighing the safe-haven channel. There is some relief this morning from diplomatic talks between the US and Iran in New York, but I would not read that as a settled picture.
Today’s data is awkward for anyone trying to pick a direction. Durable goods are forecast at -0.3% after +1.1%, and Michigan sentiment is expected to slide to 47.8 from 51.7. At the same time, one-year inflation expectations in that survey are forecast to rise to 4.6% from 4.0%. Weak growth alongside higher inflation expectations is exactly the mix that can pull gold in two directions at once.
Underneath the noise, the bigger picture has not changed. Physically backed gold ETFs took in about $18 billion in August and holdings reached a record 4,189 tonnes, while the People’s Bank of China has now added to its reserves for 22 months in a row. I see that as patient demand sitting under the market, not a reason to ignore the short-term pressure.
Asia & Europe Sessions
Asian liquidity was thin, with mainland China, Taiwan and South Korea closed for the Mid-Autumn holiday. Gold stayed inside roughly $4,257 to $4,296, with an early push towards the top of that range that faded before buyers stepped back in. As Europe took over, gold climbed back above $4,280 and the dollar softened slightly. To me it looks like a market catching its breath before the US data, not one that has made up its mind.
Technical Analysis
On the bigger picture, the weekly chart still shows one of the strongest advances I have seen in gold, from around $2,200 in early 2024 to the January peak near $5,595. What I am looking at now is a correction inside that move, not the end of it. On the daily chart, gold bottomed around $4,000 in the summer, rallied to roughly $4,700 in August and has since printed lower highs. That is a downtrend until proven otherwise.
Zooming in, the H1 and H4 charts show the slide from the $4,400 area on 18 September down to Thursday’s low near $4,245. Since then the M30 chart has been building a base between roughly $4,255 and $4,285, and price is now back at the top of it. The signals I am seeing on Investing.com tell the same story: buy readings on the 30-minute and hourly charts, but sell readings on the 5-hour, daily and weekly charts. RSI is in the mid-50s, so momentum is neutral rather than oversold. My reading is that short-term buyers are active, but the higher timeframes have not turned.
Key Levels
- $4,296-$4,305: this morning’s high and Thursday’s high near $4,305. This is the first real test, and I want to see gold hold above it before I trust the bounce.
- $4,312-$4,323: a stronger resistance cluster where earlier pivots sit.
- $4,347-$4,353: the next major resistance area, with the $4,400 swing high above it.
- $4,271: the daily pivot from Thursday’s range, which price is currently hovering around.
- $4,257-$4,265: today’s low and the short-term pivot zone.
- $4,244-$4,235: the important support zone, combining Thursday’s low with the 16 September post-Fed low.
- $4,203-$4,200: deeper support if $4,235 gives way on a closing basis.
My Gold Outlook Today
My main scenario is a choppy session with a slight downside bias while gold stays below $4,300-$4,305. The bounce from $4,244 has been orderly, but it has not yet reclaimed anything that matters, and the higher timeframes are still pointing down. If the data supports yields, I would expect another look at $4,257-$4,265 and possibly the $4,244-$4,235 zone.
The alternative is a relief rally. The bullish case strengthens if gold holds above $4,305 while yields ease, for example on weak durable goods or softer inflation expectations. That could open $4,312-$4,323 and, if momentum builds, $4,347-$4,353.
For me, a sustained break below $4,235, judged on closes rather than a single spike, would invalidate my cautious-bounce view and put $4,200 in play. On the upside, a firm hold above $4,323 would weaken my downside bias. I would rather wait for a reaction at one of these levels than chase the middle of the range.
What I’m Watching Today
- 10:15 BST: John Williams speaks. I am listening for anything on inflation persistence and whether another hike is needed.
- 13:30 BST: US durable goods orders, forecast at -0.3% with the core reading at +0.6%.
- 15:00 BST: final Michigan sentiment and inflation expectations, plus the Atlanta Fed GDPNow update. The one-year inflation expectations figure matters most to me.
- All day: the 10-year yield and oil headlines from Hormuz, since those two have been driving gold more than the data.


